Thursday, January 16, 2014
What does it take to be a Data Scientist?
I was looking at some of the job ads for a Data Scientist and found the desired skills/qualifications section quite interesting. The following is a list of companies and the educational qualification, statistical/DM skills, and software knowledge required for a Data Scientist.
SAS and R seems to be very popular. Samsung wants a PhD only. And the ad for CITI looks really amusing - I think they are looking for an army not a person :)
APPLE
Edu - Bachelor’s degree in Computer Science, Statistics, Mathematics or a related field. Master’s degree preferred
St/DM - Prior experience with AB testing (or other experimental design), statistical data analysis, model creation and refinement on big data sets
SW - Working knowledge of SQL (Hadoop/Hive preferred), SAS, R, Python, or Java
CITI
Edu - PhD/Post Doc from a renown institution in any advanced quantitative modeling oriented discipline including but not limited to Machine learning, Statistics, Marketing Science, Operations Research, Econometrics, Stochastic Finance, Distributed and parallel computing, Digital media analytics, etc.
St/DM -
1. Advanced statistical methods including complex multi-variate statistical methods, discrete choice modeling, conjoint based analysis
2. Machine learning including Bayesian methods, reinforcement learning, Neural networks, Support vector machines, Hidden Markov Models, relevance vector machines, Probabilistic/ Evidential Reasoning
3. Operations Research (Queuing, Markov Models, DEA, Integer Programming, Dynamic programming, Stochastic Programming, Game theory)
4. Macroeconomic modeling, Leading indicator analysis, Long term and near term Forecasting, Time series based methods, Bayesian multivariate regression methods, ARCH/GARCH/VAR models and other advanced regression methods, Mathematical economics, System dynamics, Stochastic control, Nonlinear dynamic models, etc. Prior practical industrial scale modeling exposure is a must.
5. Advanced quantitative methods relevant to modeling consumer experience in the digital world. Experience in web log mining for visitor segmentation, visitor behavior modeling, common path analysis, conversion analysis, abandonment analysis, promotion analytics, buzz analysis, sentiment analysis, social networking analysis etc is a must.
6. Latent class models, Multivariate logit/probit/tobit models, Multinomial logistic models, Marketing mix modeling, Hidden Markov models, Conjoint methods, Market research and optimization methods. Prior experience in customer mindset modeling, customer loyalty, customer choice, brand equity, advertisements/promotion mix, etc is a must.
7. Parallelizing existing traditional or modern (machine learning) based algorithms, Randomized algorithms, Simulations and Simulation based methods including Markov Chain Monte Carlo, parallel and distributed simulations, next gen optimization methods, etc. Knowledge of Hadoop/grid based programming for large scale problem solving is a must.
SW - Proven ability in model building and application experience in data mining techniques and tools (SAS and/or other modeling packages like R, Matlab, Mathematica, ILOG etc)
DELL
Edu - Master’s Degree/ Bachelors with 5 years’ work experience in business analytics, reporting, and process design
St/DM - Strong understanding and implementation of predictive / analytical modeling techniques, theories, principles, and practices Specific experience in more than one of: statistical modeling, machine learning and text mining techniques
SW - Excellent knowledge of data mining / predictive modeling tools such as SAS, R, or SPSS
Edu - M.S. or Ph.D. in a relevant technical field, or 4+ years experience in a relevant role
St/DM - Extensive experience solving analytical problems using quantitative approaches
SW -
1. Fluency with at least one scripting language such as Python or PHP
2. Familiarity with relational databases and SQL
3. Expert knowledge of an analysis tool such as R, Matlab, or SAS
4. Experience working with large data sets, experience working with distributed computing tools a plus (Map/Reduce, Hadoop, Hive, etc.)
Edu - Masters, Phd, or equivalent experience in a quantitative field (computer science, physics, mathematics, bioinformatics, etc.)
St/DM - Strong background in Machine Learning, Statistics, Information Retrieval, or Graph Analysis
SW -
1. Some experience working with large datasets, preferably using tools like Hadoop, MapReduce, Pig, or Hive
2. Experience programming in an object oriented language (Java, C++, etc)
3. Knowledge of scripting languages like Ruby or Python, familiarity with web frameworks a plus
4. Comfortable with data analysis & visualization using tools like R, Matlab, or SciPy
MICROSOFT
Edu - Bachelor’s degree in Mathematics, Statistics or Computer Science with strong statistical background
St/DM - Demonstrated statistical analysis skills in a business environment
SW - Knowledge of structured (SQL) and non-structured (Log files) data bases
YAHOO
Edu - PhD in a quantitative discipline (Applied Mathematics, Statistics, Computer Science, Operations Research, or related field)
St/DM - Experience utilizing both qualitative analysis (e.g. content analysis, phenomenology, hypothesis testing) and quantitative analysis techniques (e.g. clustering, regression, pattern recognition, descriptive and inferential statistics)
SW - R preferred
SAMSUNG
Edu - PhD Computer Science Candidate Only
St/DM - Strong background in machine learning
SW - Strong programming experience in Java/C++
WALMART
Edu - Bachelors degree in Statistics, Economics, Analytics, Mathematics, Computer Science, Information Technology or related field and 10 years experience in an analytics related field OR Masters' degree in Statistics, Economics, Analytics, Mathematics, Computer Science, Information Technology, or related field and 8 years experience in an analytics related field
St/DM - Certificate in business analytics, data mining, or statistical analysis
SW -
1. 7+ years experience with statistical programming languages (for example, SAS, R)
2. 7+ years experience with SQL and relational databases (for example, DB2, Oracle, SQL Server)
Tuesday, January 14, 2014
Analytics 3.0

This slide is from the ebook available at http://iianalytics.com/a3/
The full article on Analytics 3.0 is at http://hbr.org/2013/12/analytics-30/ar/1
Thursday, July 25, 2013
All these research studies!
Reading about claims/findings from many of these research studies often makes me shake my head in disbelief. The latest one I saw was titled "Scientists suggest beer after a workout". Below are some of the claims/statements from that article:
1. The study involved a group of students who were asked to work out until their body temperature reached 104 degrees. Researchers then gave beer to half of the students and water to the other half.
2. Professor Manuel Garzon announced the results at a press conference in Granada, saying the hydration effect in those who drank beer was “slightly better,”
3. And their conclusion? Researchers at Granada University in Spain have found that beer can help the body rehydrate better after a workout than water or Gatorade.
My questions:
My questions:
1. How many students? How were they selected? How were they split in the two groups?
2. Slightly better? Really??
3. Wow, that was fast!!
Friday, March 16, 2012

Wednesday, January 25, 2012
You want more drama? Use less data!
Beware of making statements on averages or proportions based on small samples. Take the example of a 10% response rate for your customer base. Now consider a particular customer segment - let's say, customers who bought hiking boots. And you find out that the response rate within this group is 30%. Before you consider that as something to share with your clients or before assuming/concluding that this segment will be a significant driver in your response model - look at the size of this segment. Chances are, that segment will be too small to get any business interest or there is an interaction effect you should explore and identify (in your model).
In many instances, I have come across interesting findings and patterns that turn out be nothing but occurrences in extremely small samples.
The title of this post and the idea of writing something on this came from "Deceptive Data and Statistical Skullduggery" by Gordon H. Bell.
Sunday, January 8, 2012
Sampling or Weights
Below is a small excerpt from a post on one of my favorite Analytics blogs - Data Miners Blog
When we have a binary target variable and our goal is to predict the rare outcome - we either do oversampling or we use weights.
Oversampling is when we use all the rare outcomes and an equal-sized random sample of the common outcomes. This is most useful when there are a large number of cases, and reducing the number of rows makes the modeling tool run faster.
The second approach is weighting. Rare cases are given a weight of more than 1 and common cases are given a weight less than 1, so that the sum of the weights of the two groups is equal.
Assume that we have data that is 10% rare and 90% common, and we oversample so it is 50%-50%. If we are using weights, we will multiply each rare observation by 5 and each common observation by 5/9.
---
Dear Readers,
In
the past few months, my roles and responsibilities have changed and I
will be spending lesser time on this blog. Instead of lengthy/detailed
posts once in 2-3 months, I would like to do short posts more regularly.
These posts will now be mostly tips, common mistakes, something new
about an old familiar technique we all know, interesting insights, etc.
And all these will be based on my own experiences or something I came
across a book, or a website. I hope you will like the new format, and find these short posts useful and
interesting.
Thanks,
DataLLigence
Tuesday, October 4, 2011
Discount/Variety stores productivity
I was looking at the "RetailSails 2011 Chain Store Productivity Report" available at retailsails. I do most of my "everyday needs" shopping at Discount/Variety stores and so that section was the most interesting to me.
The table has the following columns:
1. Sales
2. YoY change in Sales
3. # of Stores
4. Average Store Size
5. Sales per Store
6. YoY change in Sales/Store
7. Sales per sqft
8. YoY change in Sales/sqft
So, which companies are doing good?
Total Sales is very much dependent on the number of stores and the size of the stores. YoY change in Sales would have been useful if there was information on the change in the number of stores, YoY.
Sales per store is again strongly associated with size of the store. But does bigger store size always mean higher sales?

Walmart has the biggest stores, with an average size of about 162,000 sqft. But Costco, with an average store size of 145,000 sqft has an impressive sales per store - $58 million more than a Walmart store. A Costco store is about 0.9 times the size of a Walmart store but its sales is 1.9 times that of a Walmart store.
Another interesting comparison is Target and Sam's Club. Almost the same store size, but sales at a Sam's Club store is almost twice that of a Target store.
You will see a very similar story if you use Sales per sqft instead of Sales per store. But what makes these analyses incomplete is the absence of average price/item. The comparison between Costco and Walmart is obvious - prices will be much lower at Walmart. But what about Target & Sam's Club? Prices at Sam's Club may still be lower but can that alone explain a Target store having twice the sales of a Sam's Club? Other factors that can be the reason behind a Target store's higher sales will be - optimized layouts (more efficient use of space, more items per unit area), higher traffic, larger proportion of high ticket items, etc..
And how are these companies growing?
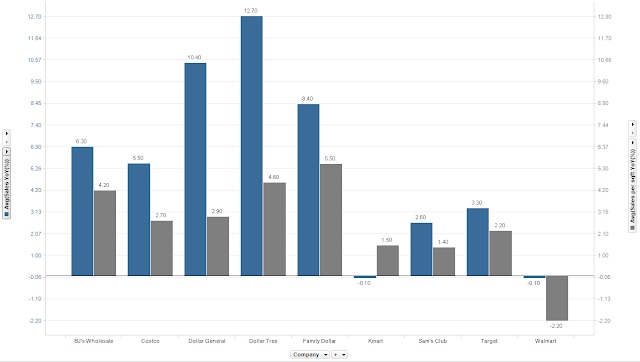
Looks good - almost all of these companies are seeing positive trends in both total sales and sales per sqft, YoY. What about Kmart? Sales per sqft is growing YoY but total sales YoY is down. The first thing that comes to my mind - Kmart must have closed some of its non-performing stores. Any other reasons you can think of?
Subscribe to:
Posts (Atom)

